Clove
Clove is a B2B e-commerce workflow that puts sales data, stock, purchase orders and customer engagement at the seller's fingertips. Its Advertising Manager and Inventory tools had grown cluttered and hard to navigate. We redesigned them around how sellers actually decide, and verified it with eye-tracking.
- Client
- Clove
- What we did
- UX research, interaction design, UI redesign, design system, validation
- Scope
- Advertising Manager + Inventory Management
- Methods
- Contextual inquiry, interviews, usability testing, eye-tracking heatmaps
- Outcome
- Lower cognitive friction, faster onboarding, less abandonment
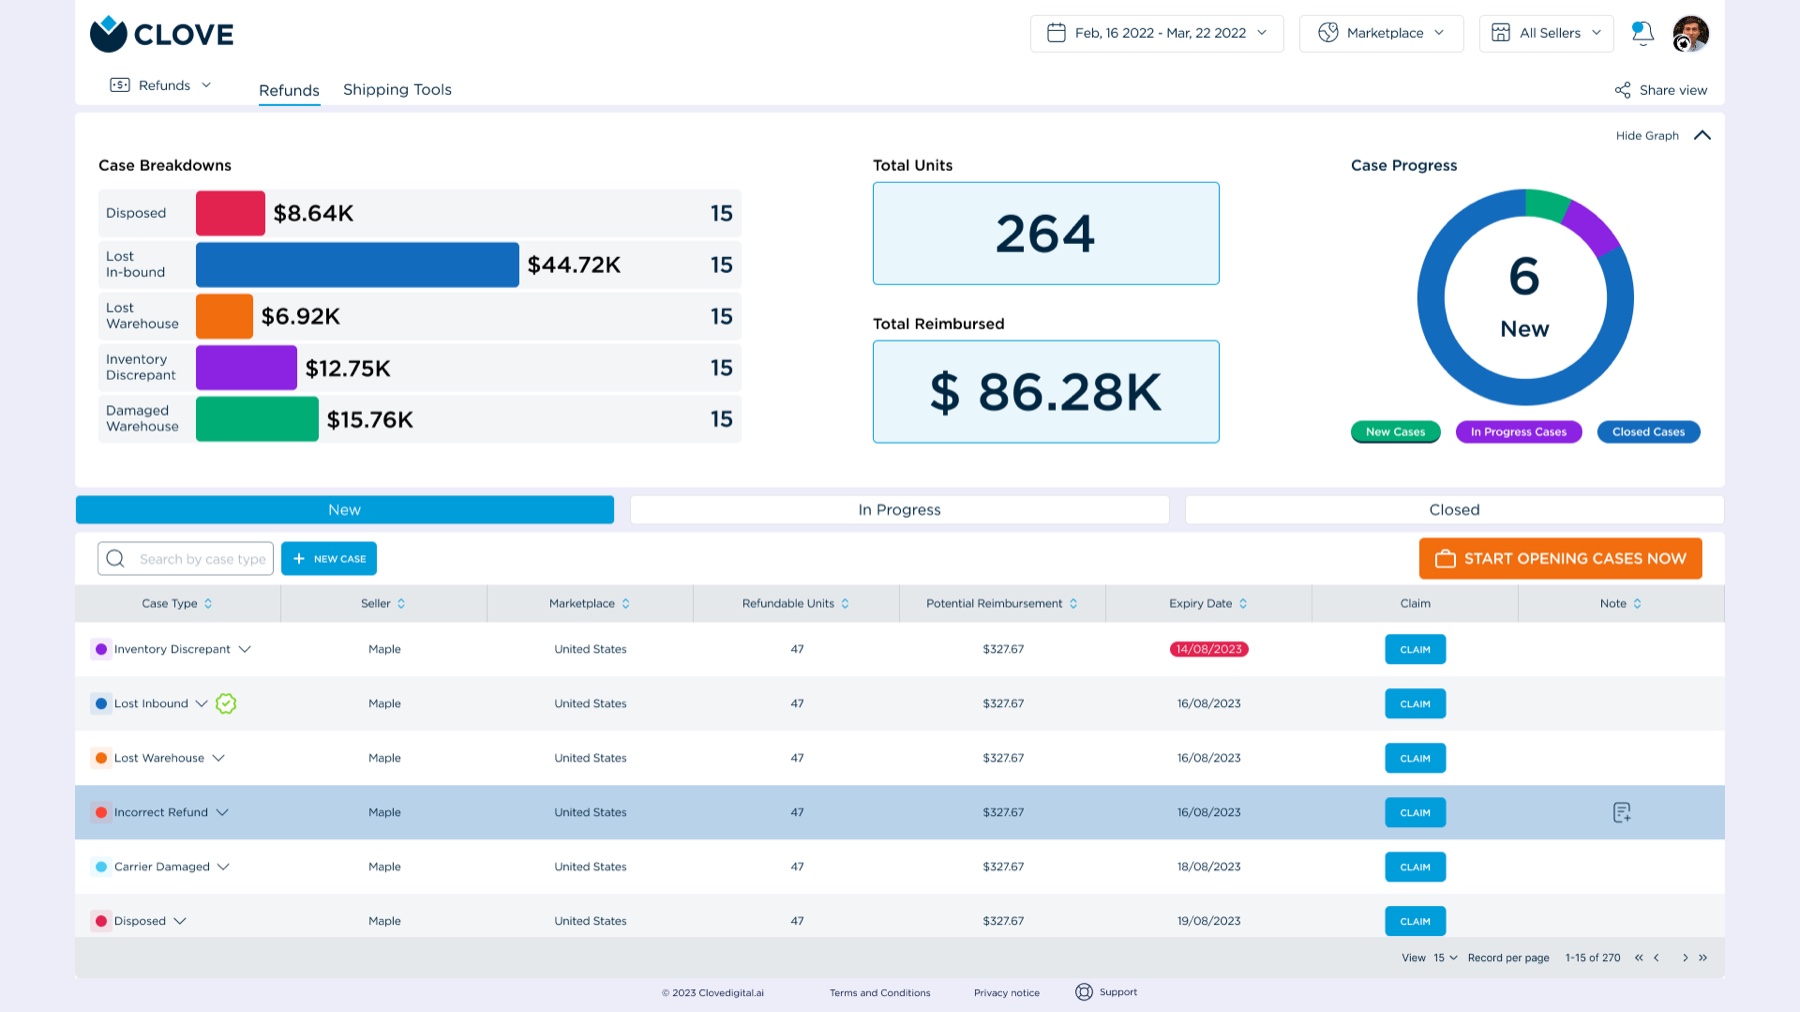
Too much dashboard, too little decision
Amazon sellers manage inventory, sales and analytics simultaneously to survive. Despite the data, they were overwhelmed by infinitely scrolling, disconnected tables that caused decision fatigue. Complaints clustered in three areas: key features were hard to find, charts didn't answer the questions sellers actually had, and decisions were being made on stale information.
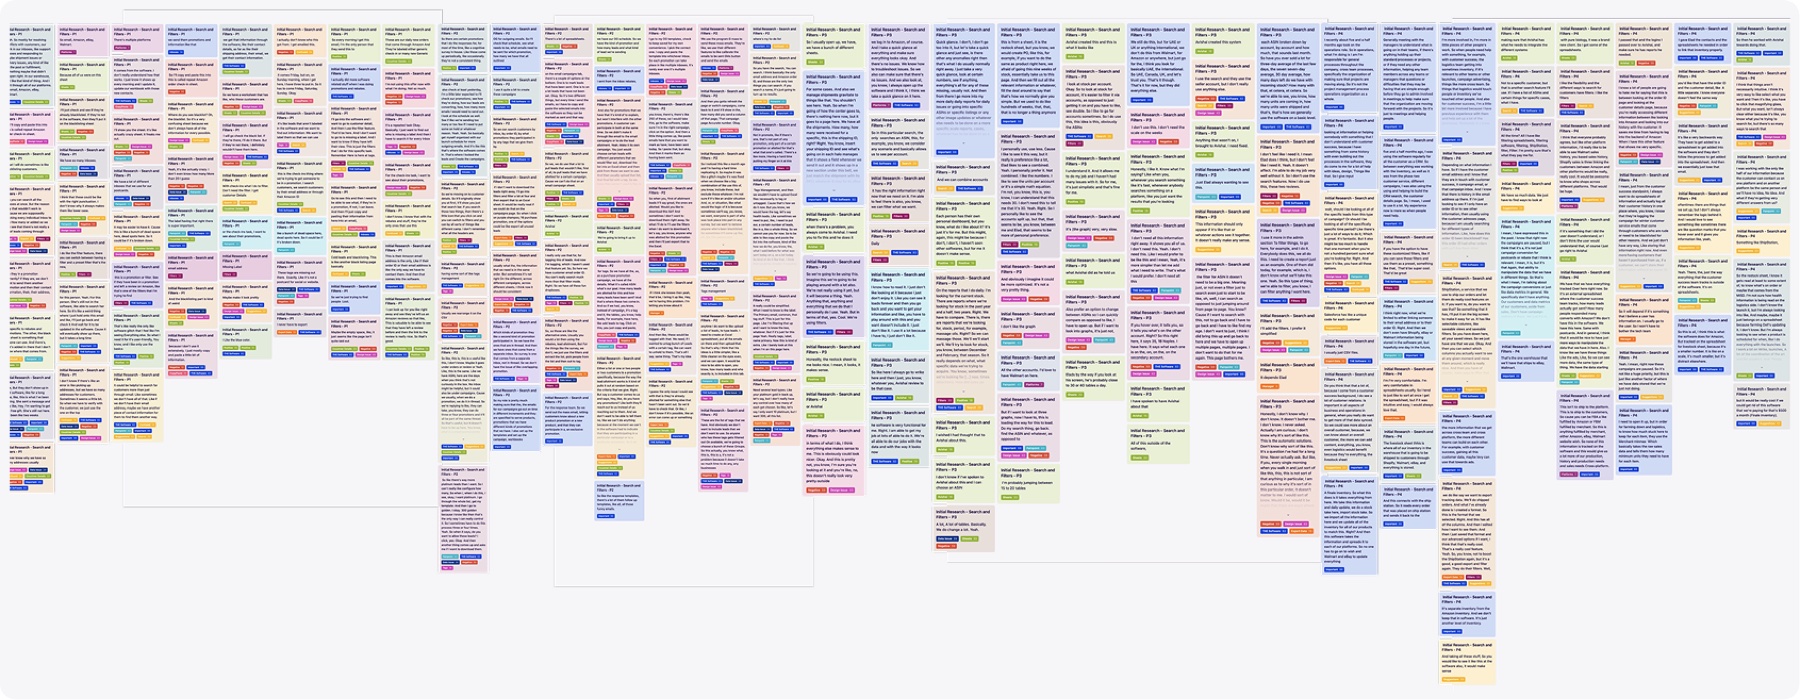
Contextual inquiry, before pixels
Sellers were observed and interviewed in the context of their real work, on top of usability sessions with current users. Three findings carried the redesign: overwhelming dashboards, navigation that buried campaign and stock tools, and workflows that forced users across multiple screens to finish one task.
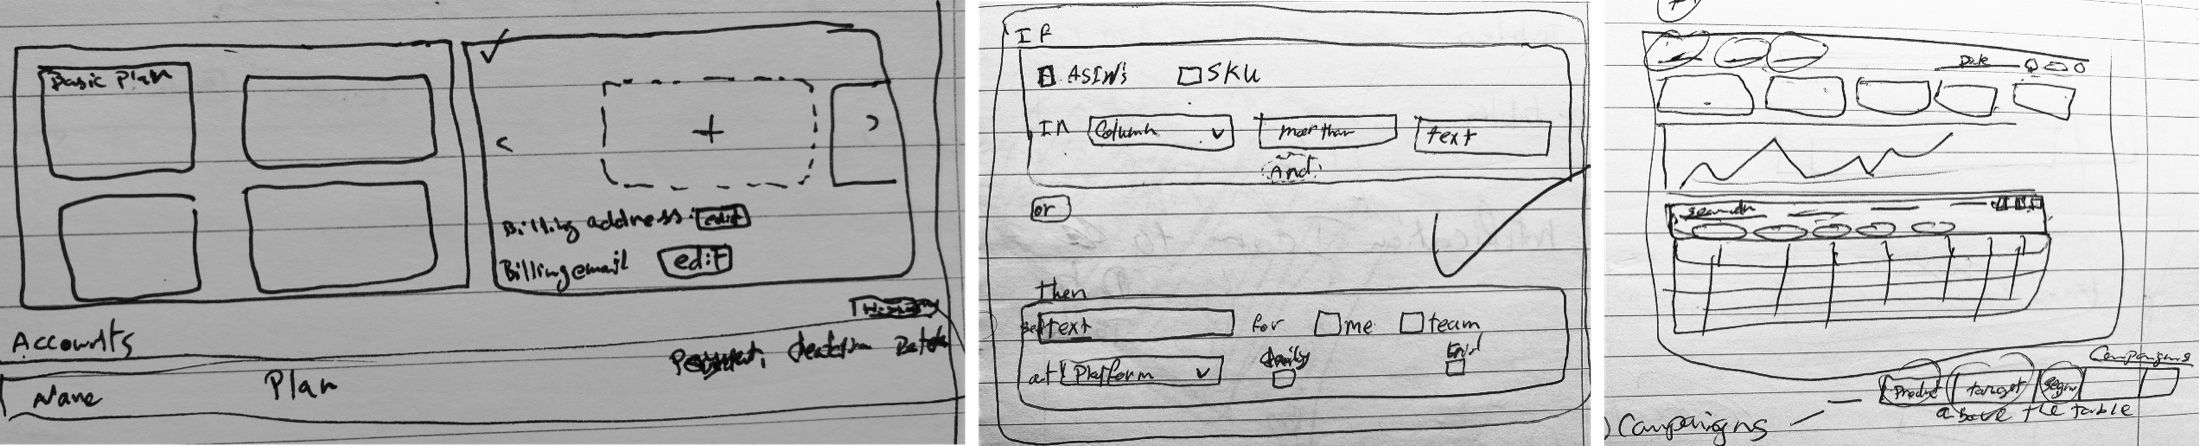
From sketch to screen
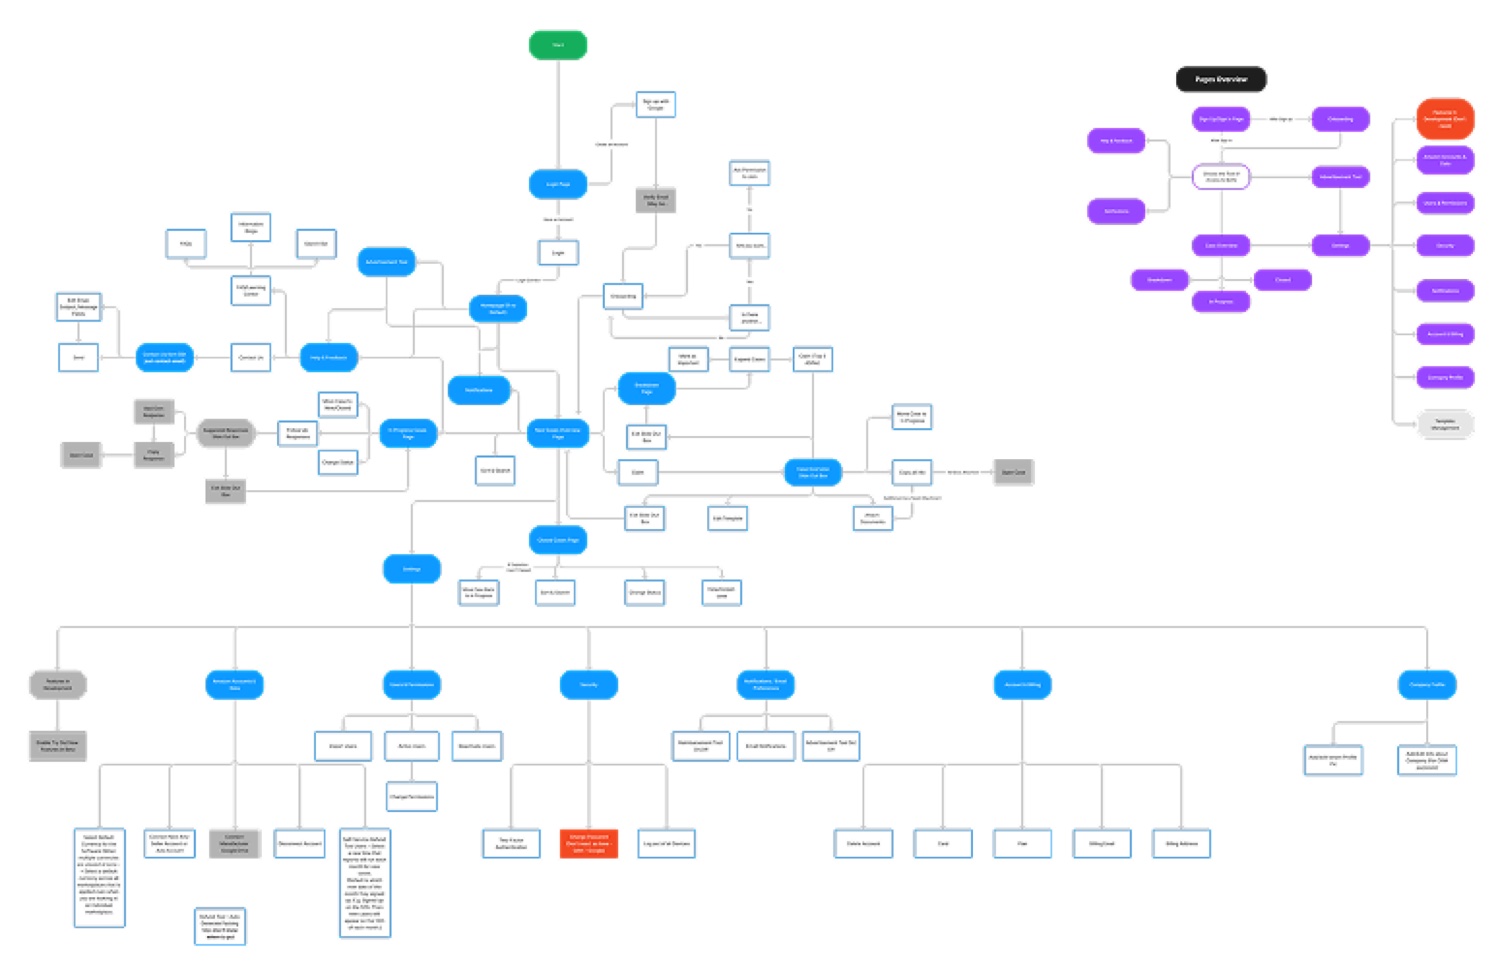
Rough sketches for the riskiest ideas, an information architecture to settle navigation, low-fidelity wireframes to agree on structure, high-fidelity screens populated with real data, then eye-tracking to check the result against behavior.
One view per decision
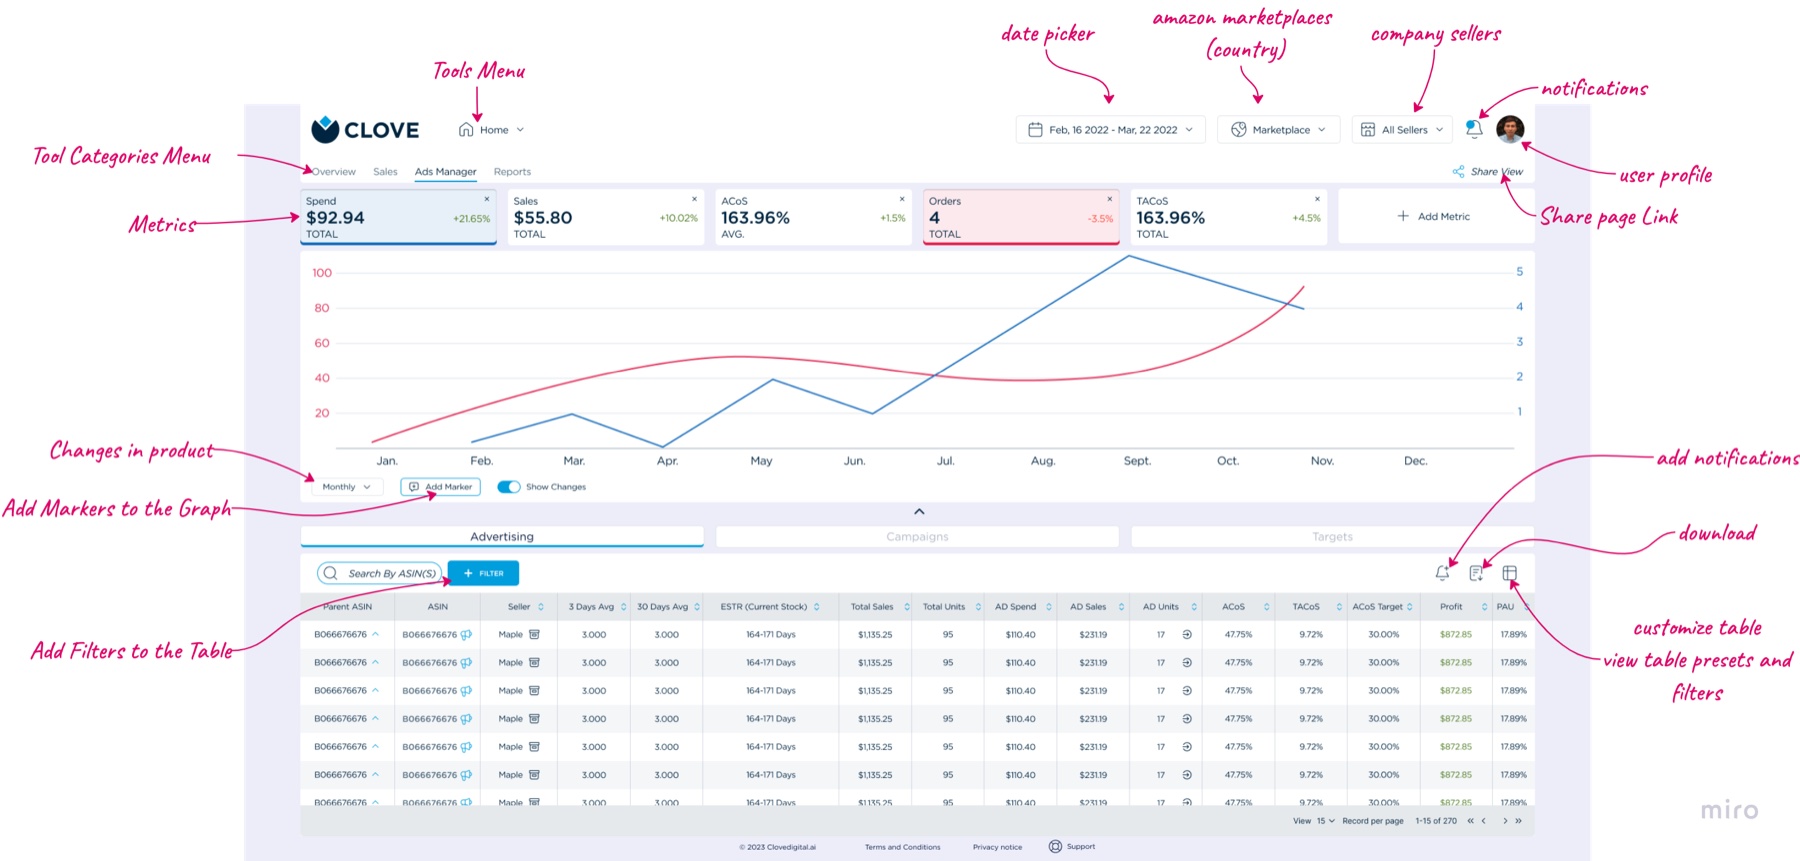
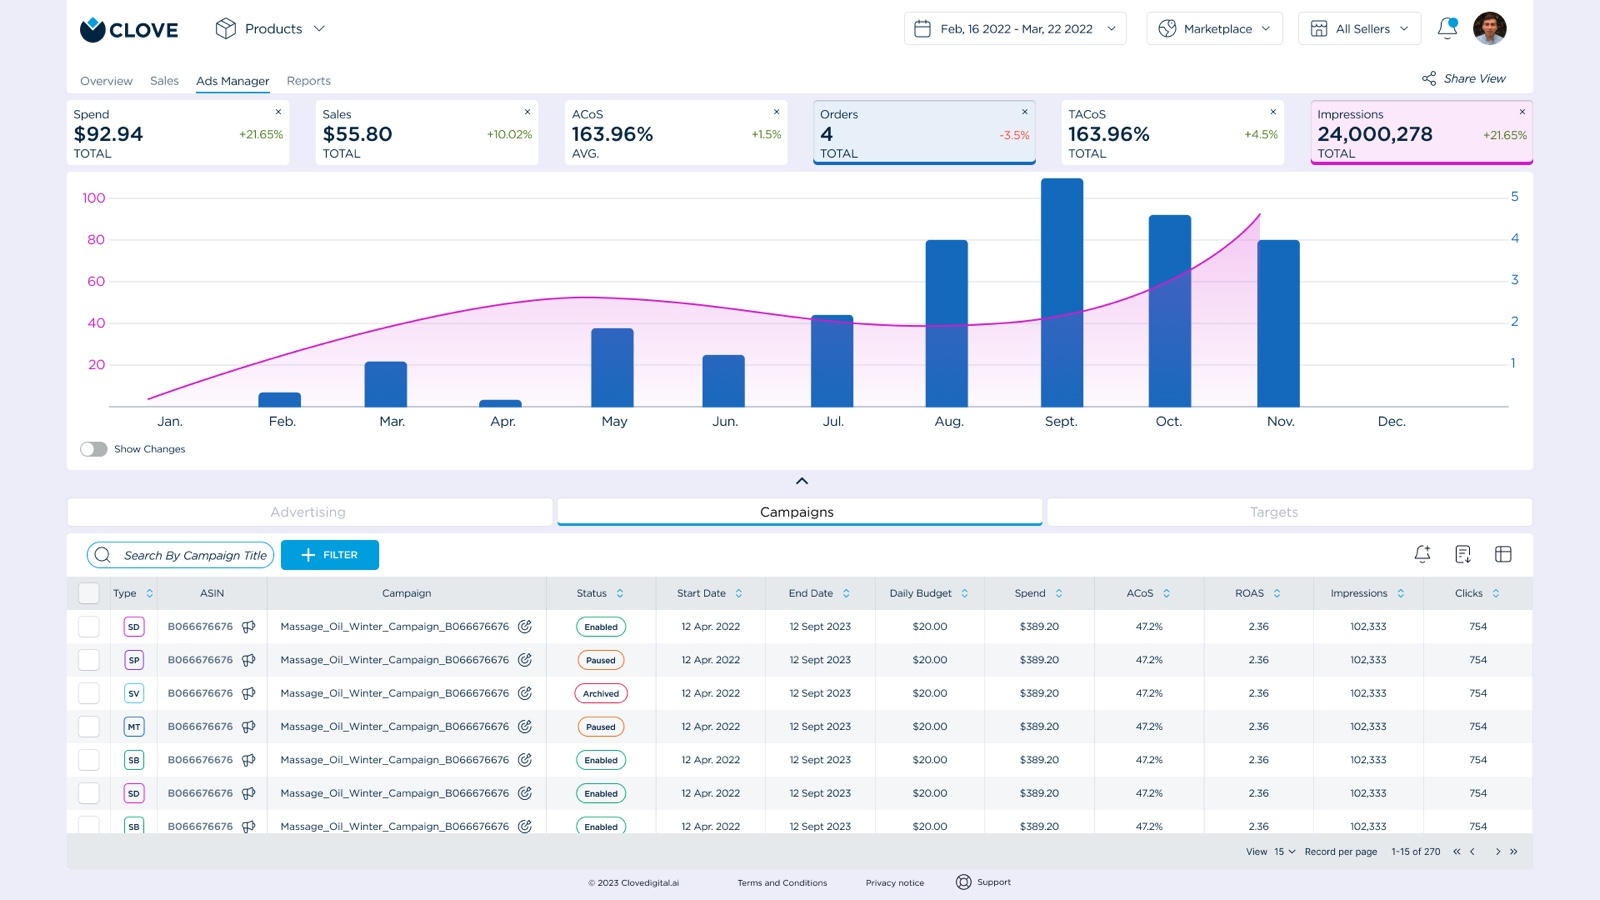
- Ad Manager: spend, sales and ACoS shown prominently with a color-coded system; charts gained hover interactions for granular insight.
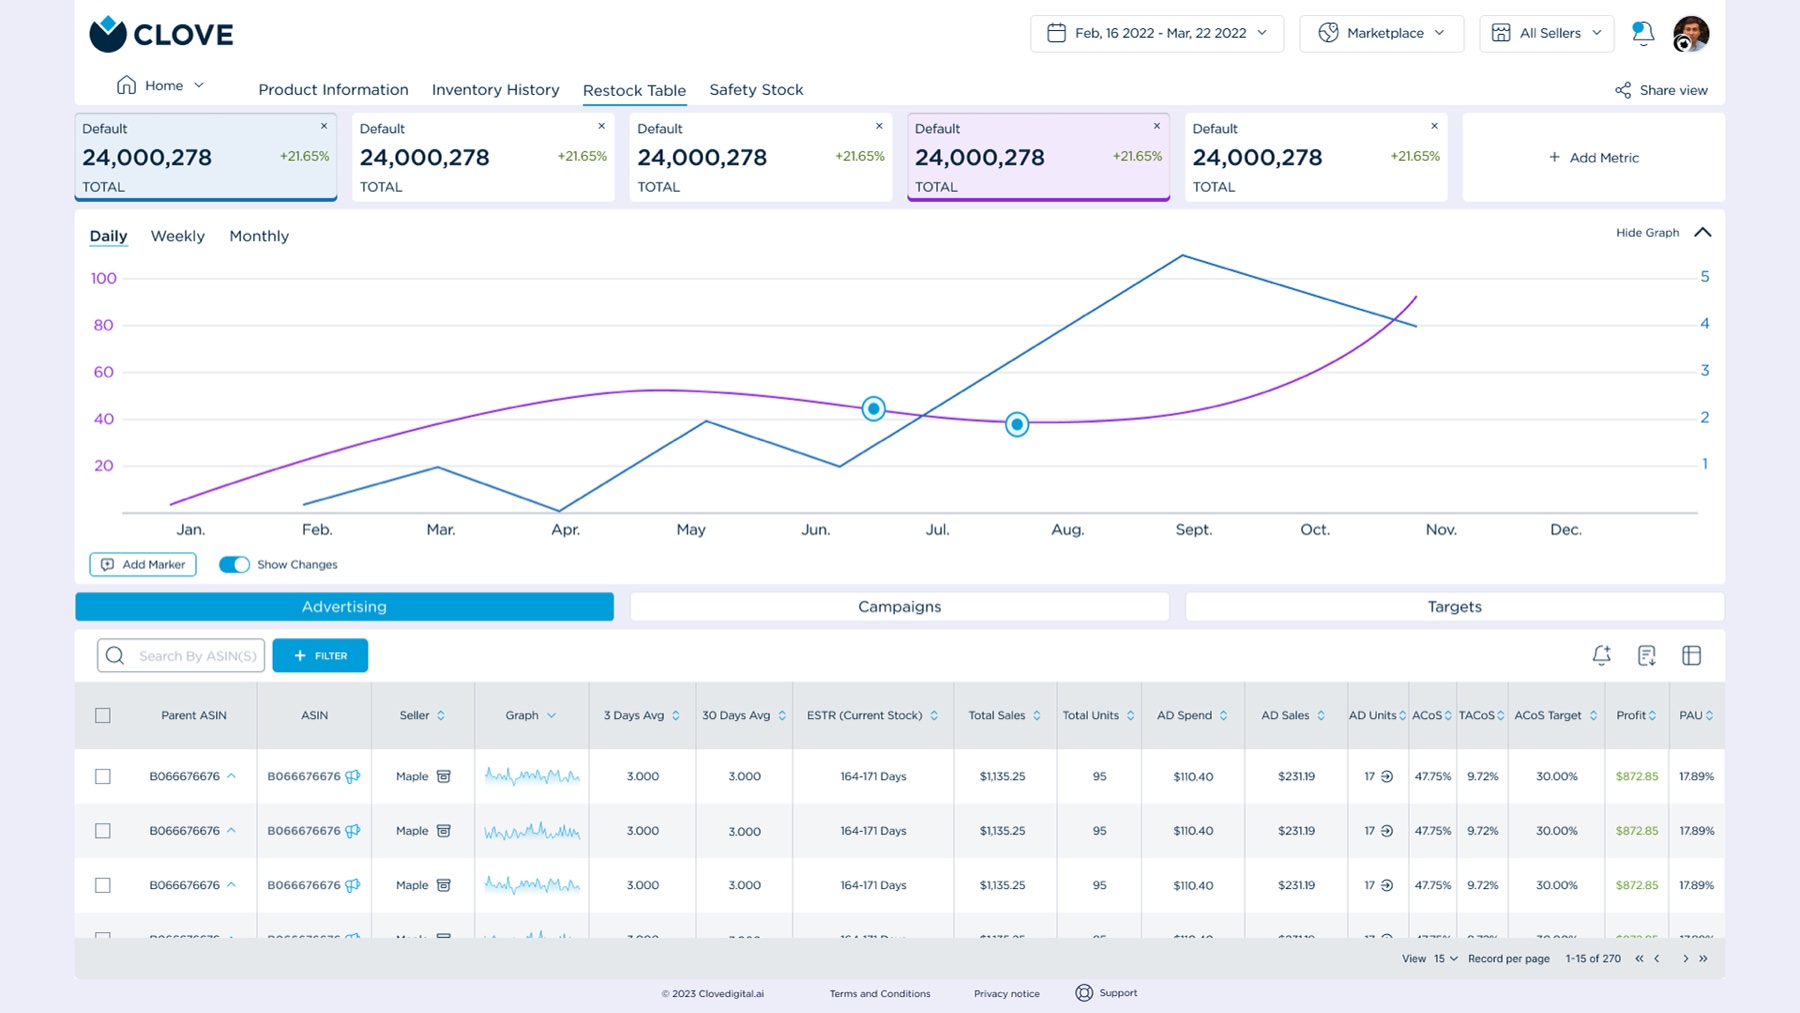
- Inventory: stock levels and restocking alerts in a single view, restock and update actions unmistakably visible.
- Design system: colour, elevation, type, icons, components, charts and layout, documented in one style guide.
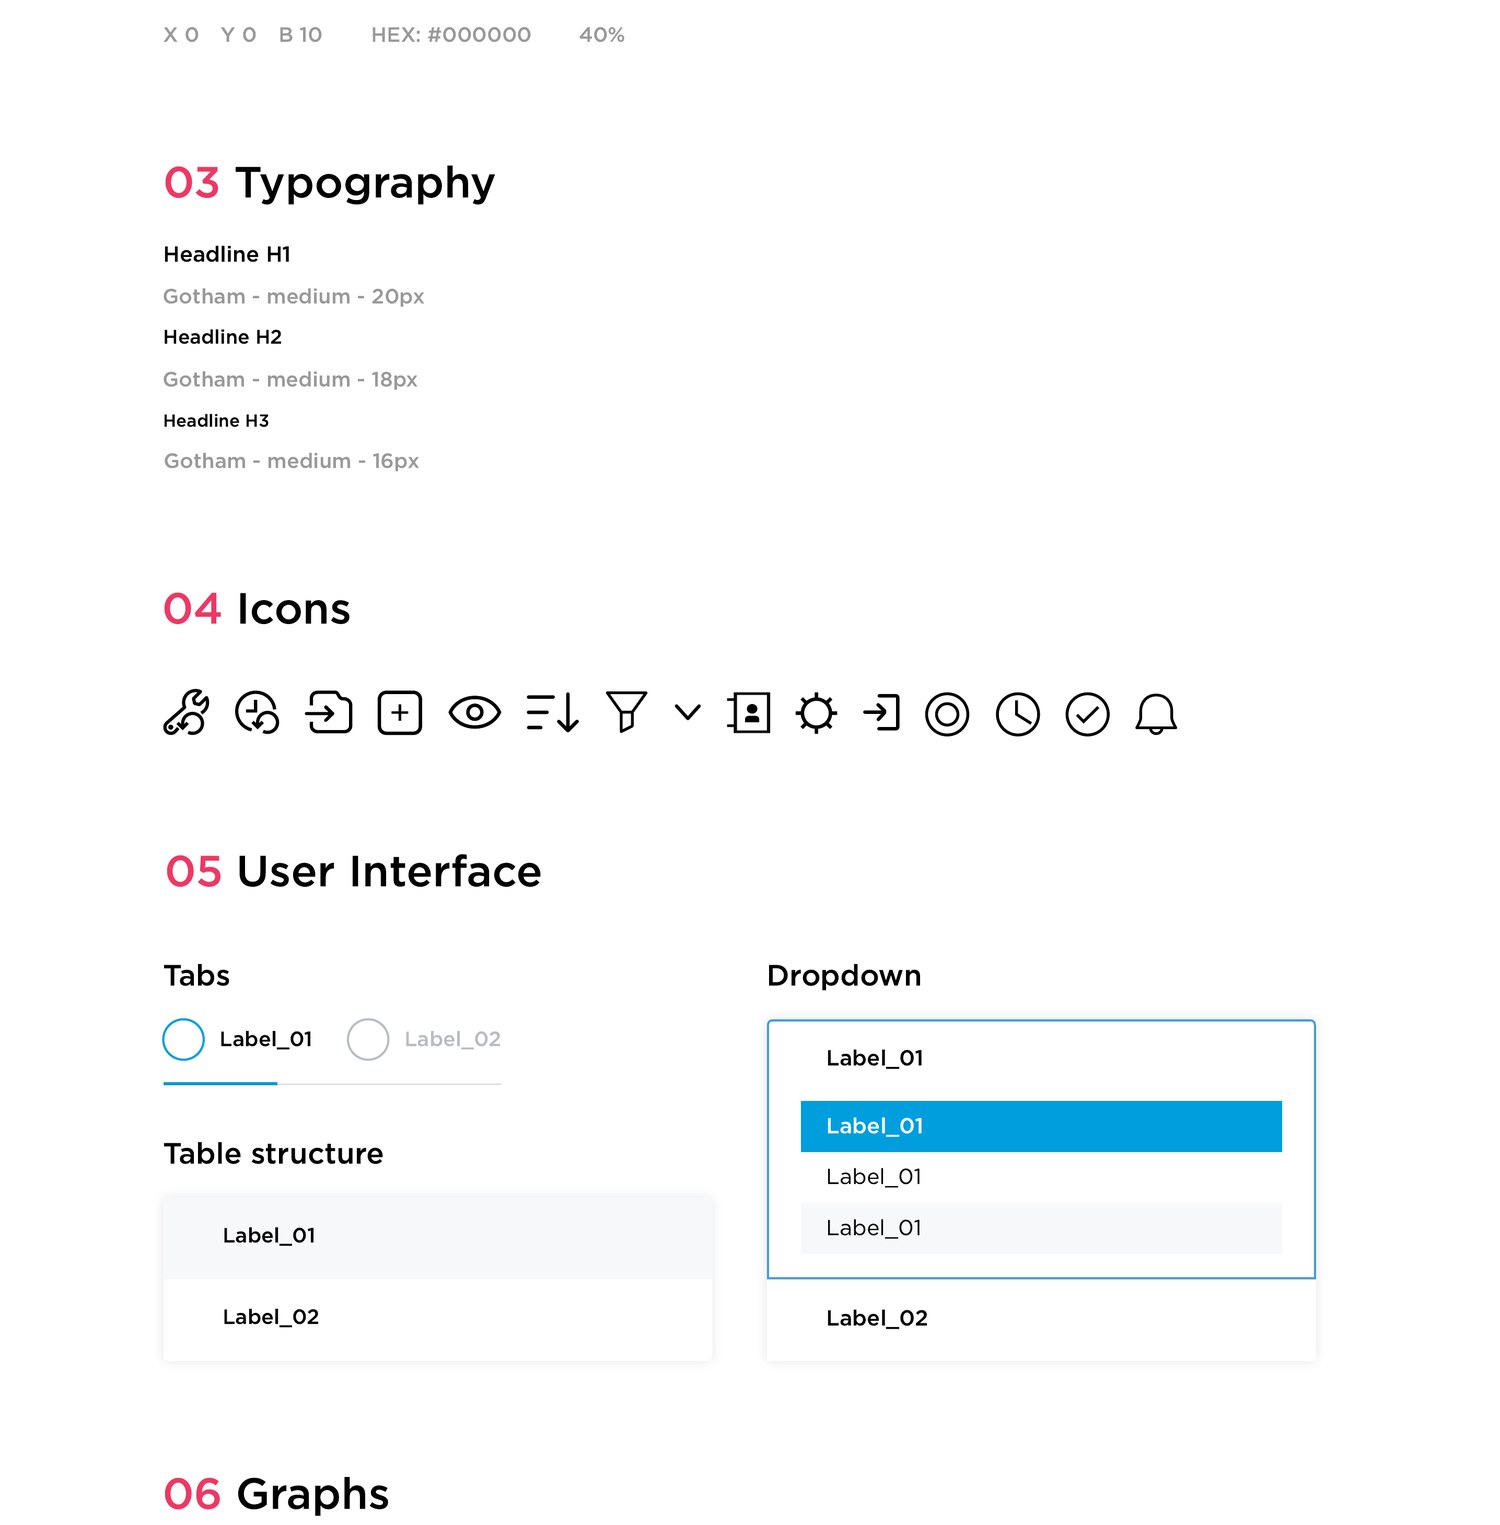
Watching where eyes go
Alongside usability tests, eye-tracking heatmaps showed where attention actually landed on the dashboards, and where it never arrived. Navigation, button placement and the color system were each adjusted from that evidence.
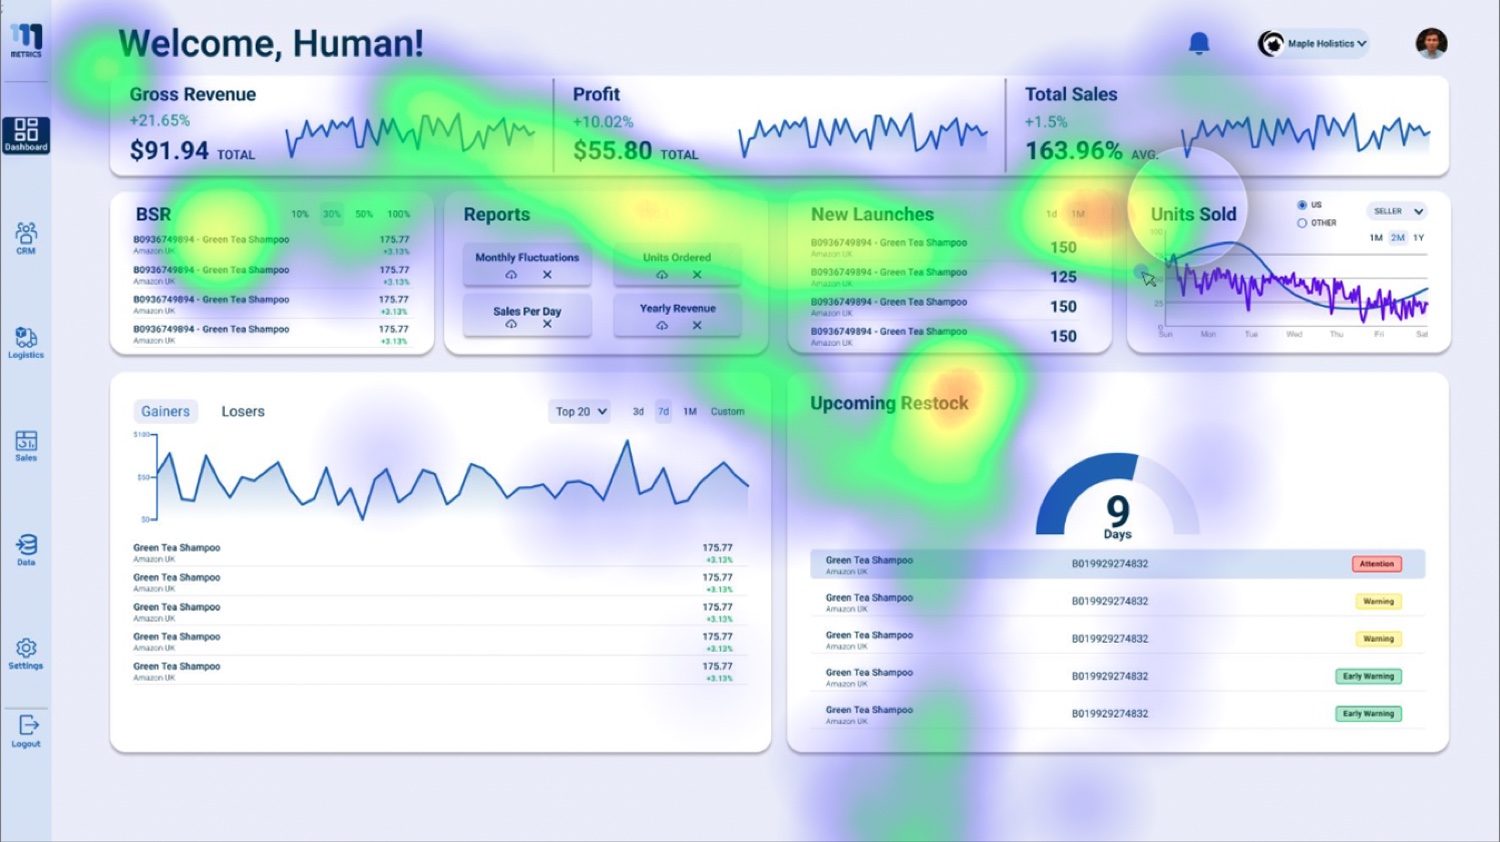
Not built on assumptions, but on actual user data and experiences.
design stages, Clove
From data wrangling to growth
The endless scroll became a unified, modular dashboard where insights are pushed to the seller through intelligent widgets instead of buried in tables. Dramatically reduced cognitive friction, a learning curve that plummeted for new users, and a significant decrease in abandonment.